Projects · Part I
Mono-Hydra++
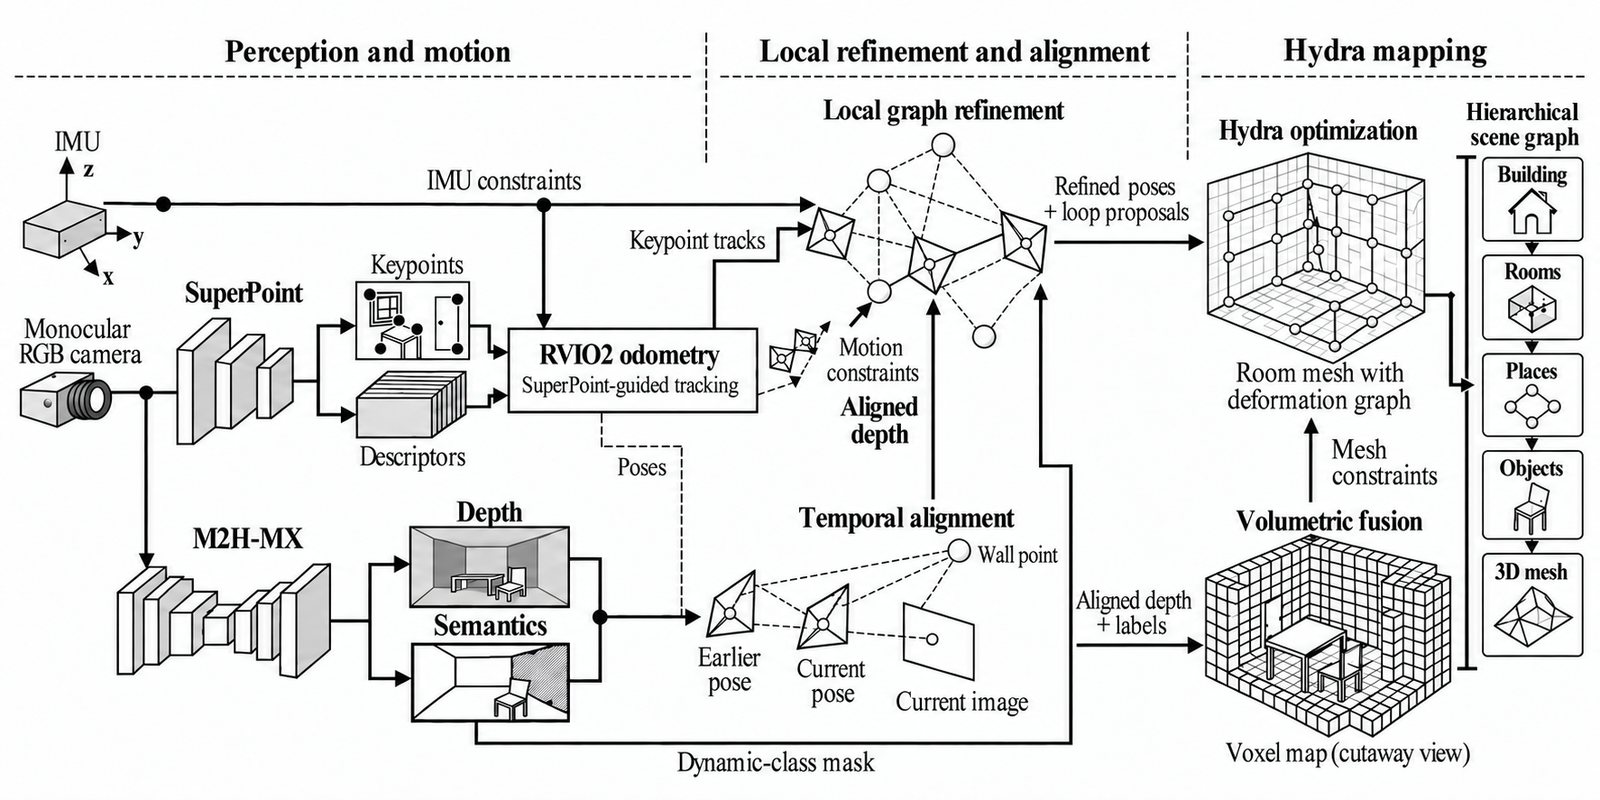
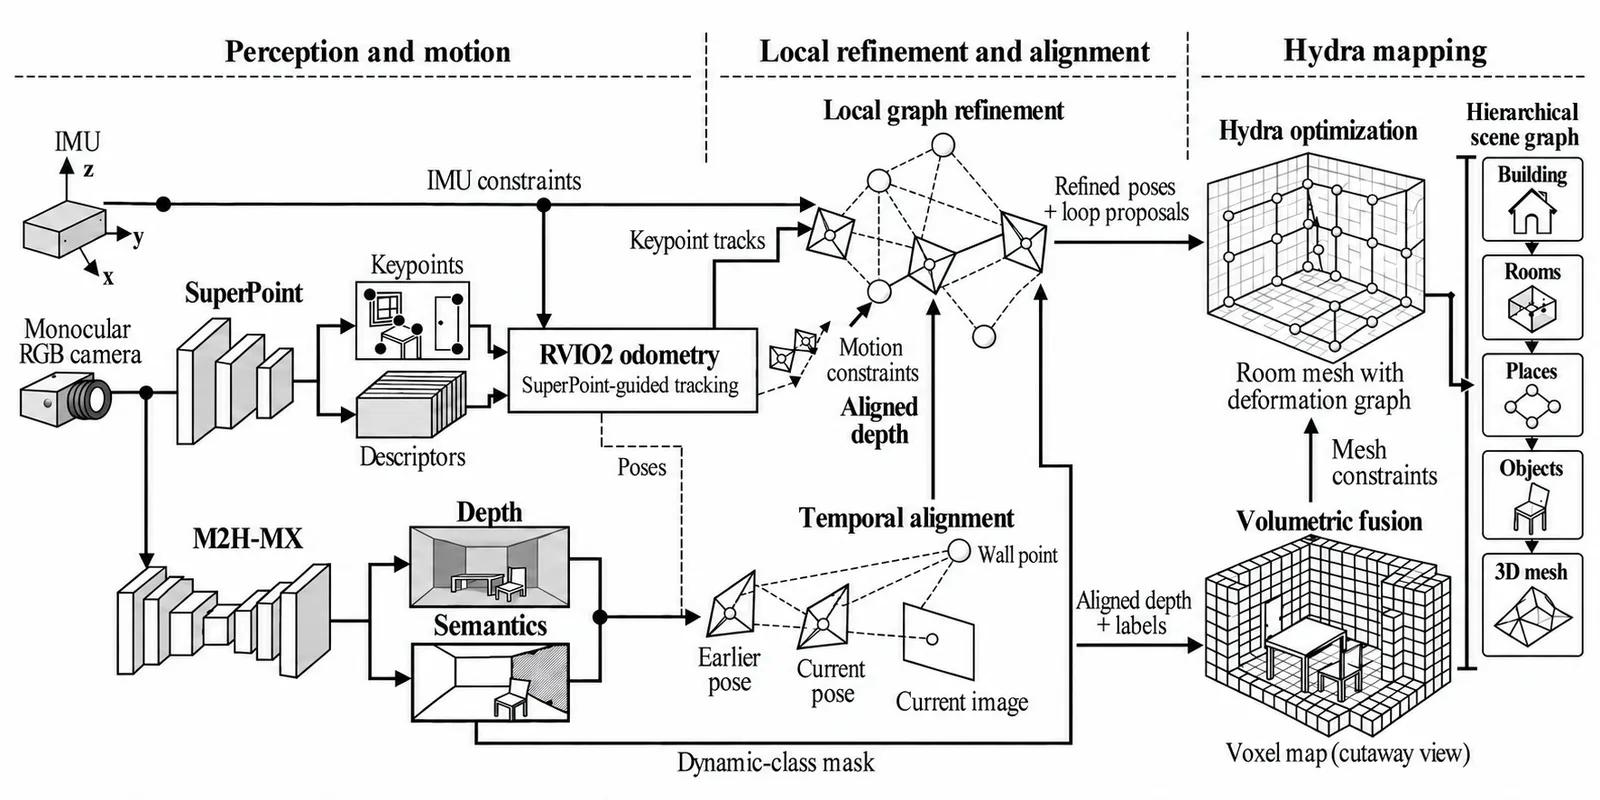
The current system. One camera, one IMU, a hierarchical 3D scene graph, and a perception loop that feeds back into state estimation.
01 — The system
What it does
Predicted sparse depth enters the visual-inertial odometry as metric anchor factors. Semantic masks keep dynamic and unreliable regions out of the estimator. The poses that come back out align the next dense predictions in time. Perception feeds the estimator and the estimator feeds perception.
Engineering ownership
My contribution
- Developed the perception–estimation loop: sparse learned depth factors, semantic masking and temporal alignment.
- Integrated perception, odometry and scene graph construction on Jetson and built and flight-tested the custom drone.
From motion estimates to refined poses and scene graphs
- 01SenseOne camera + IMU
- 02PredictLearned depth + semantic masks
- 03Refine posesVisual, motion, IMU and sparse-depth constraints
- 04MapHierarchical 3D scene graph
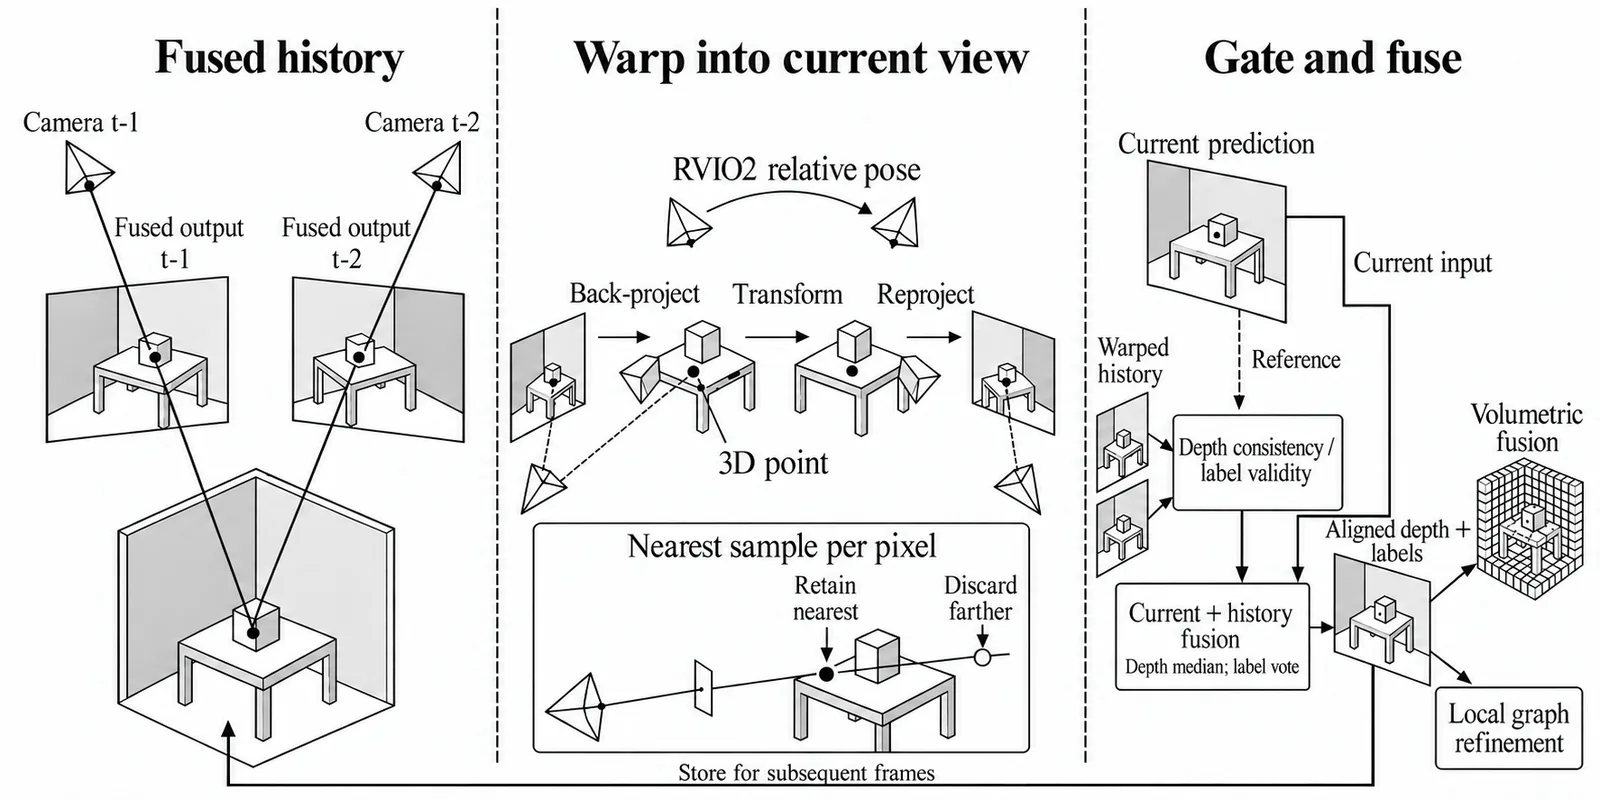
RVIO2 poses → align depth and labels across frames
Hardware × software integration
Configure the robot around one camera and an IMU.
The hardware, inference runtime and mapping backend have to work as one system. This is the configuration behind my onboard mapping work.
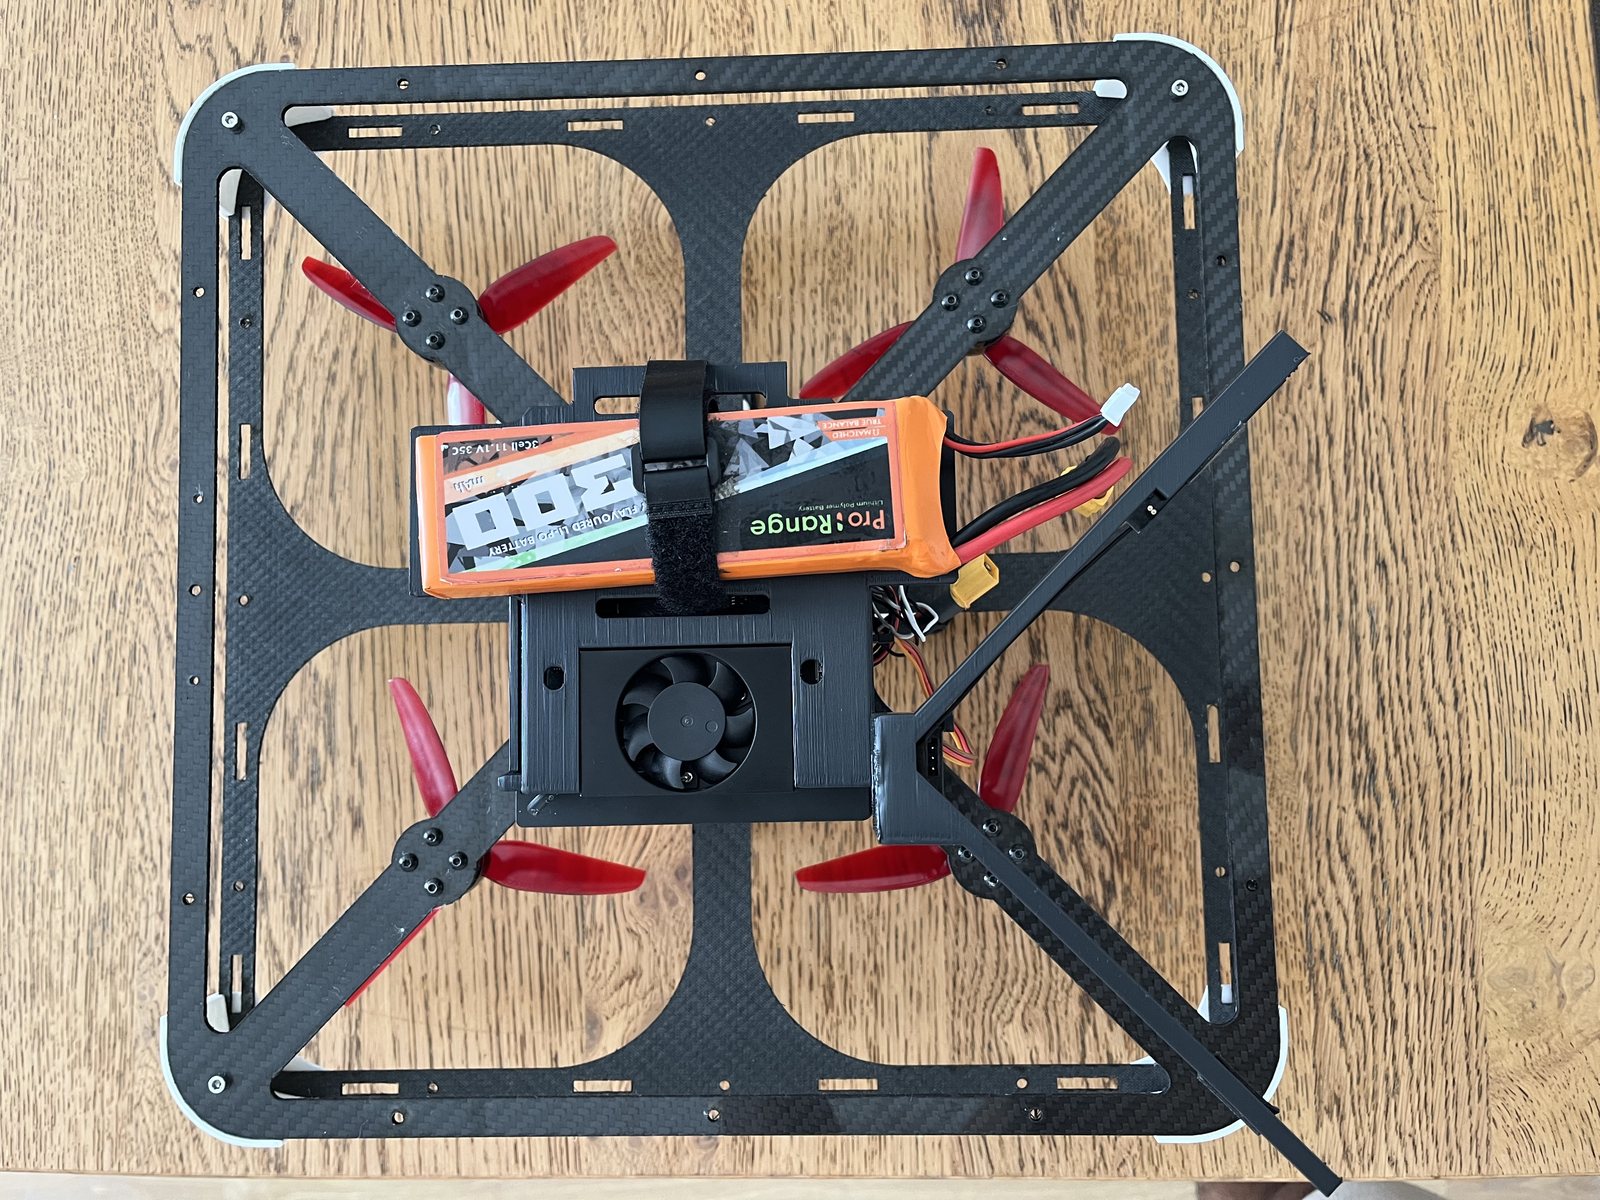
Built and flight-tested
Carry the mapping stack into the air.
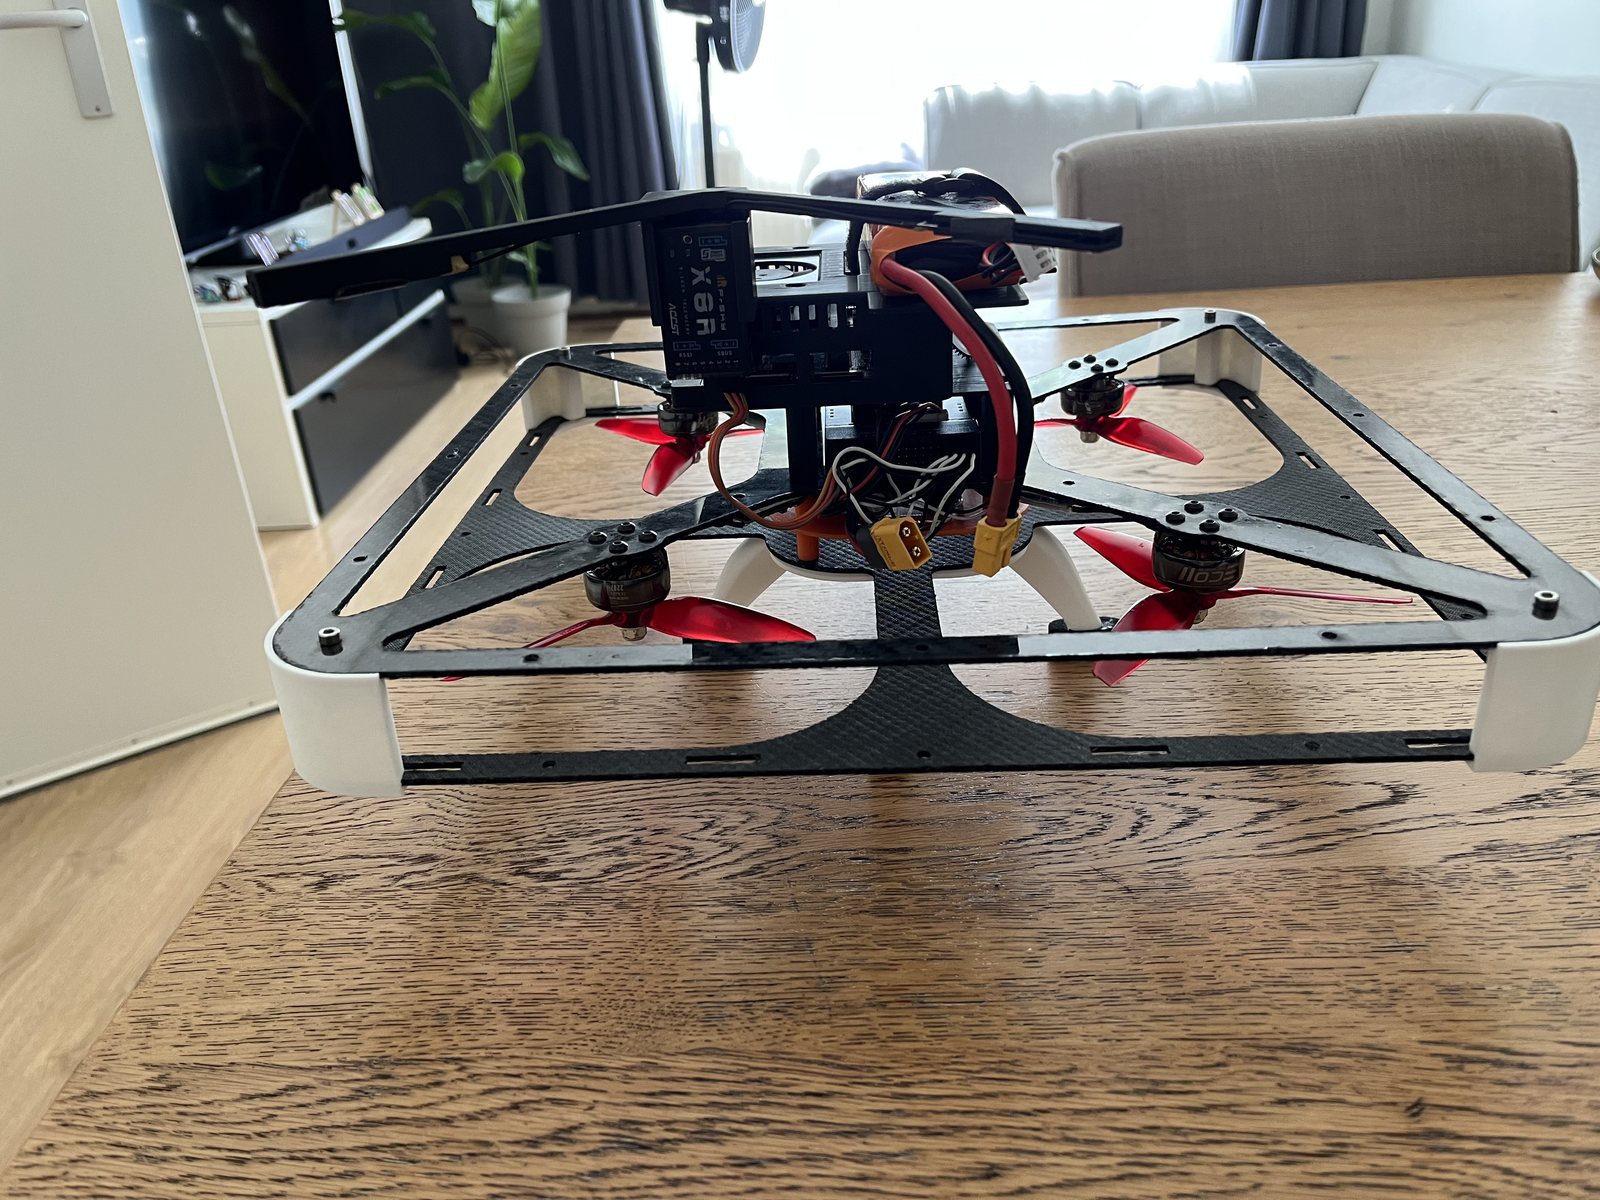
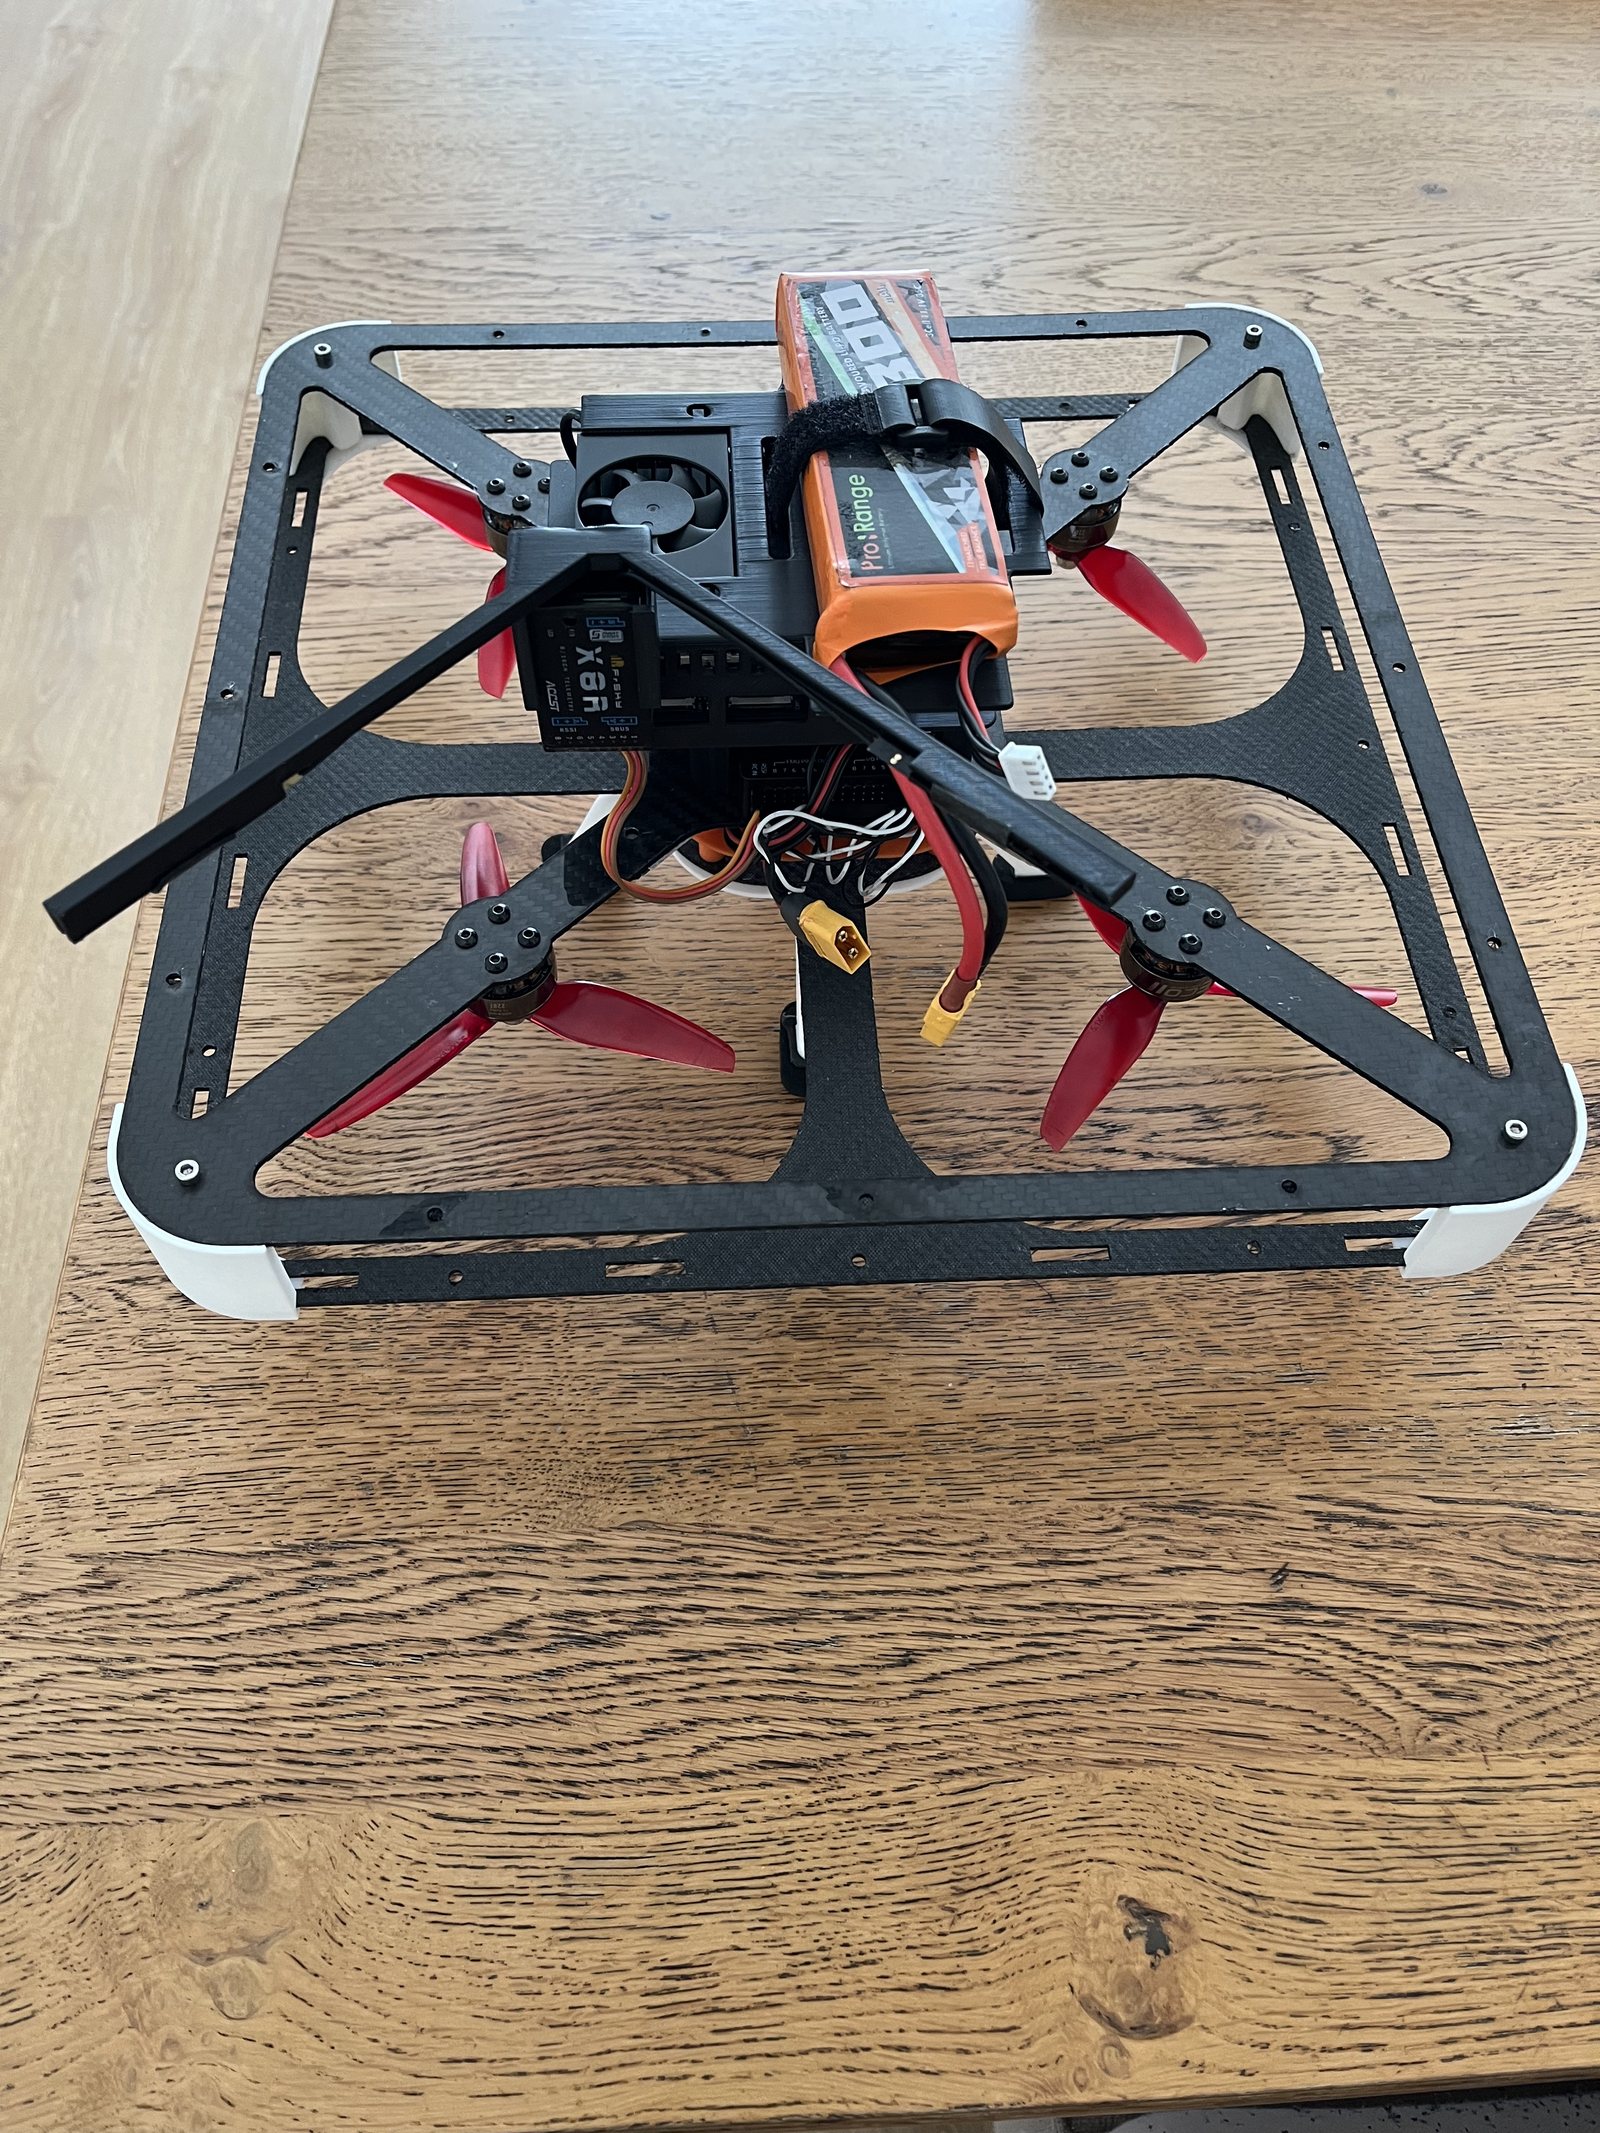
I built the custom drone and integrated perception, odometry and scene graph construction on its Jetson. The carbon frame, propeller cage, battery placement and onboard compute are visible in the hardware photographs.
- Sensing
- One RGB camera + IMU
- Compute
- Jetson Orin NX
- Inference
- ONNX → TensorRT FP16
- Mapping
- RVIO2 + local refinement + Hydra
01 / Inputs
Sense motion and appearance
RGB images provide appearance; the IMU provides inertial measurements. RVIO2 supplies motion estimates for the mapping pipeline.
RGB + IMU → motion estimates
02 / Compute
Run learned perception onboard
The Jetson Orin NX carries the perception workload. Models are exported through ONNX and run with TensorRT FP16; predicted depth and semantic labels feed the mapping stack.
Images → depth + semantic labels
03 / Integration
Align predictions and refine poses
Relative poses align predictions across frames. Selected depth samples join visual, motion and IMU constraints in local graph refinement.
Aligned predictions → refined poses
04 / Output
Construct a structured map
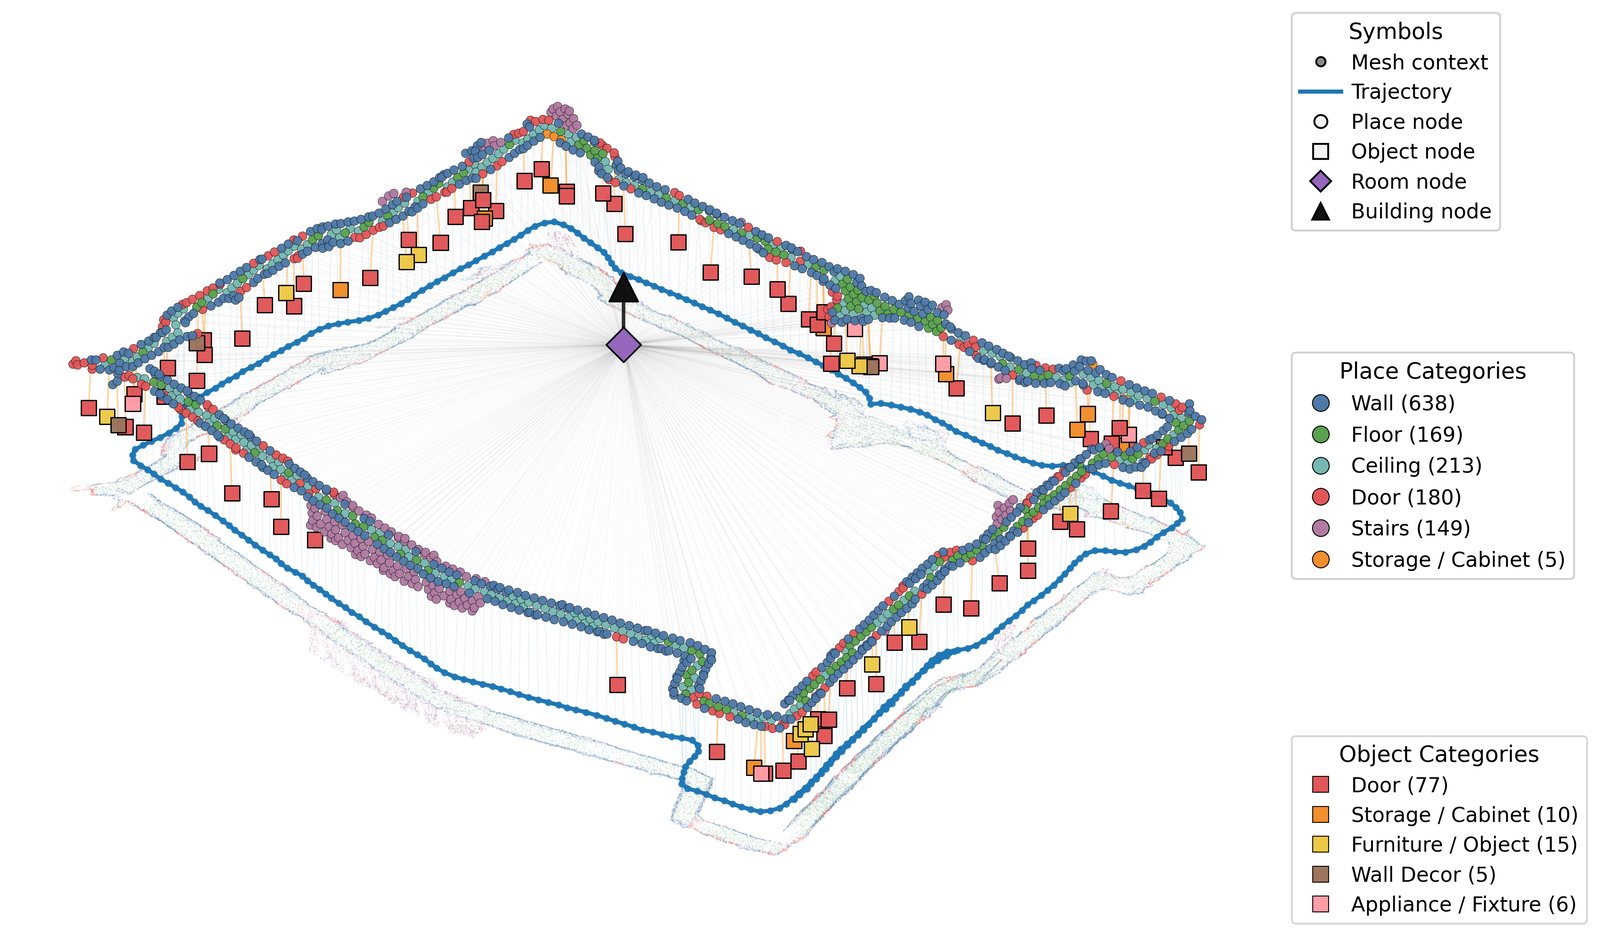
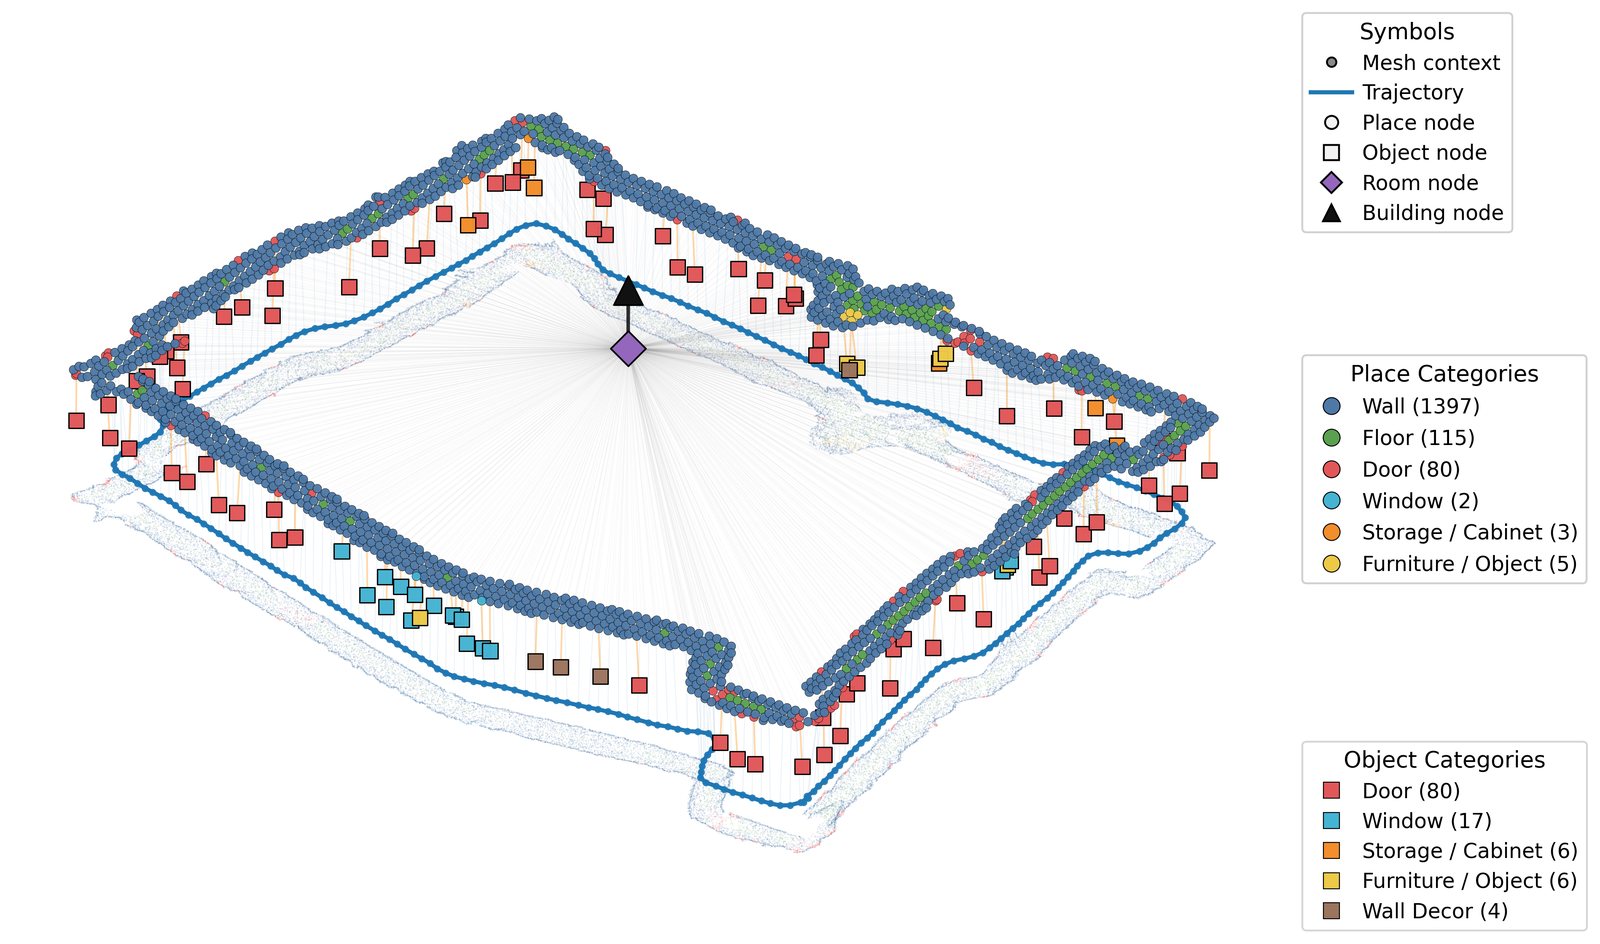
Hydra receives refined poses and loop-closure proposals, maintains the geometric map and builds the hierarchical 3D scene graph.
Geometry → objects, places and rooms
Watch the platform fly.
Inspect the onboard pose estimate.
The flight clip shows the physical platform; the mapping recordings show software output. They are separate recordings. Perception throughput is not an end-to-end mapping or flight-control rate.
Architecture / Mono-Hydra++
Trace a camera frame through the mapping stack.
RGB and IMU measurements become depth, semantic labels, motion estimates, refined poses and a hierarchical map.
01 / Inside Mono-Hydra++
Align predictions before fusing the map.
A pixel in the previous frame does not refer to the same scene point after the camera moves. RVIO2 relative poses warp historical depth and labels into the current view. The nearest sample is retained at each pixel; accepted history is fused with the current prediction using depth medians and label voting.
The output is aligned depth and labels for local graph refinement and volumetric fusion.
02 / Inside Mono-Hydra++
Turn selected depth samples into pose constraints.
Aligned depth is sampled at tracked keypoints. Depth validity, motion, reprojection and semantic checks select the samples that can become depth factors. These enter local graph refinement alongside visual tracks, RVIO2 motion and IMU constraints.
Refined poses and loop-closure proposals are passed to Hydra, which optimises the map and updates the scene graph.
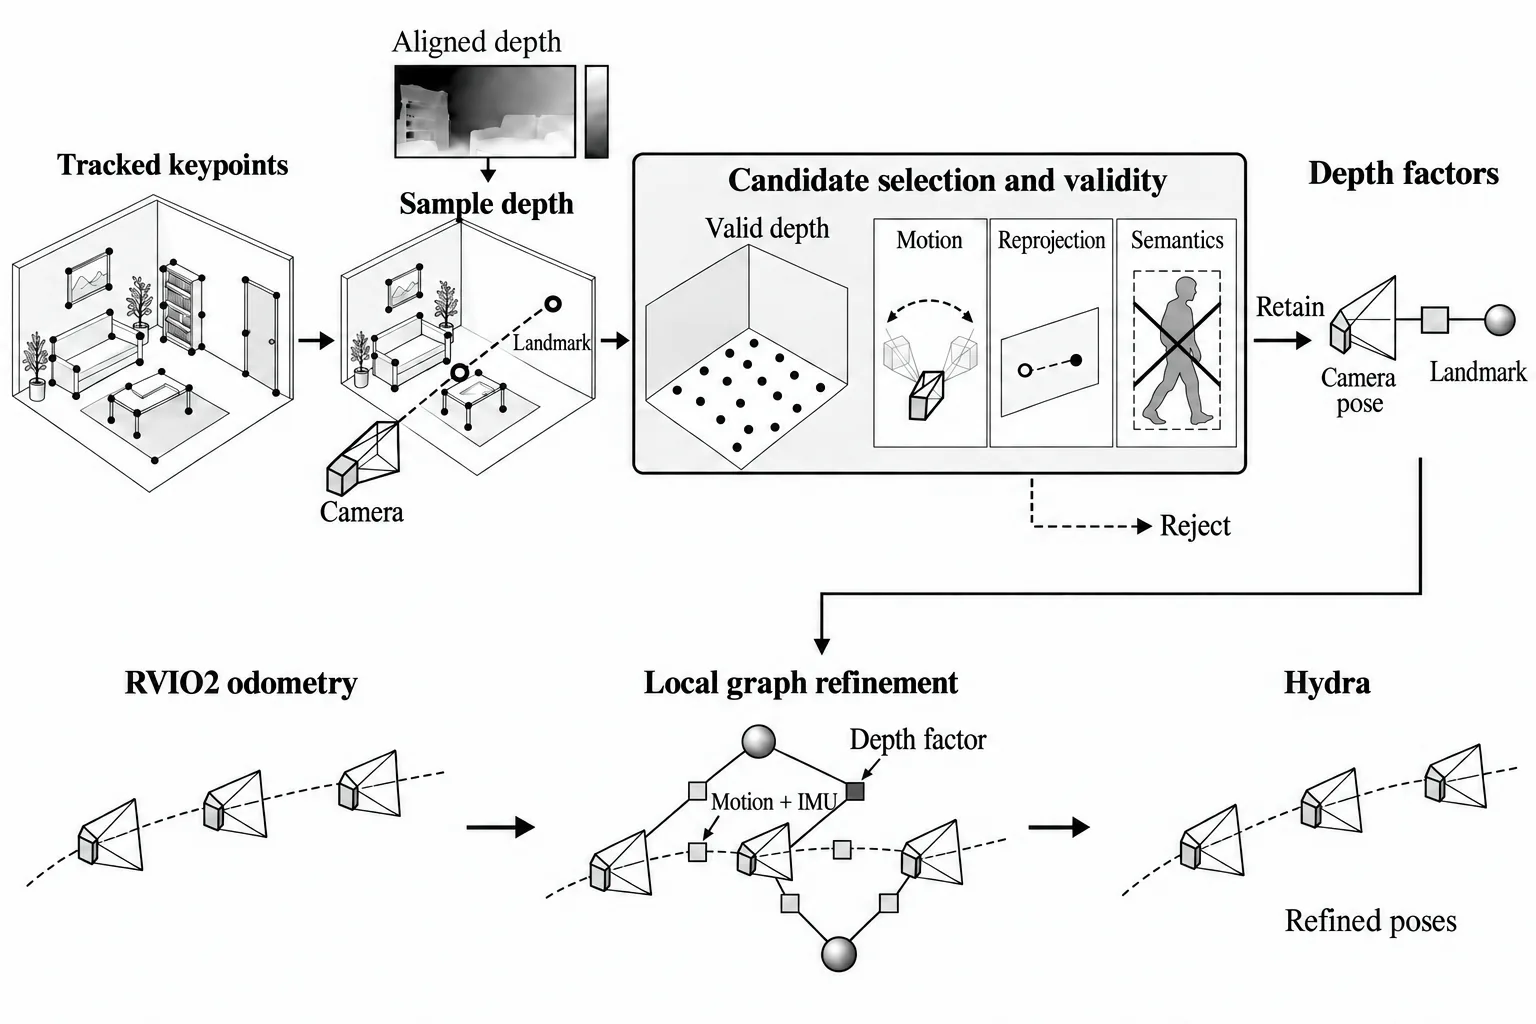
03 / Inside Mono-Hydra++
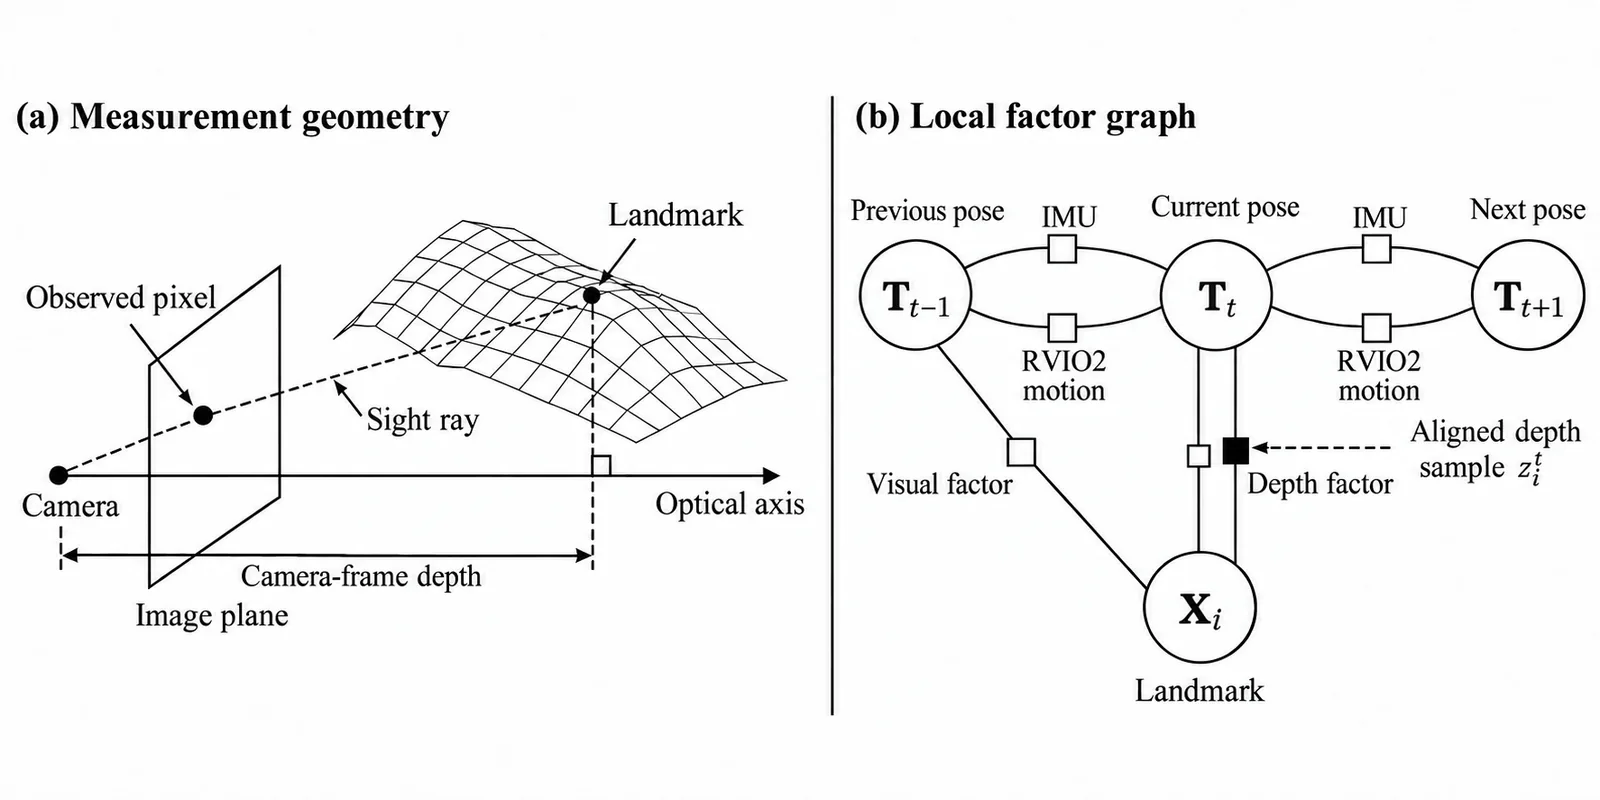
Constrain optical-axis depth in the local graph.
The depth measurement is camera-frame distance along the optical axis. A depth factor connects a camera pose and a tracked landmark; visual, motion and IMU factors provide complementary constraints.
The illustration omits velocity and bias variables to make the pose–landmark relationship easier to read.
02 — Evidence
Measured
Key numbers
- 0.08 m ITC 2nd floor mean error
- 0.033 m calibrated ATE on 7-Scenes
- 44.96 % semantic mesh mIoU on ScanNet
Every figure here appears in the thesis results registry with its source location. Conditions are stated with the number.